By Marcin Wojtyczka
14 minutes readUseful weather resources and links.
Forecasts for coastal and limited offshore sailing
Provide weather radar, wind (GSF, ECMWF and local models with resolution up to 3 km), waves and many more forecasts for kiters, surfers, paragliders, pilots, sailors and anyone else. It can be used via a browser or installed as an app on smartphones. The app is great for coastal sailing but has limitations for offshore sailing as you cannot download the GRIB files and work with it offline. As a workaround, you can take screenshots, but you will not be able to get updates offshore unless you have reliable internet.
Forecasts for coastal and offshore sailing
The following apps can be used on a smartphone, tablet or pc:
- PredictWind App for inshore and coastal sailing (full PredictWind features without GRIB viewer to work offline)
- PredictWind Offshore for offshore sailing (offline GRIB viewer, GMDSS forecasts, satellite imagery, satellite/SSB connection)
- LuckGrib for offshore sailing (offline GRIB viewer for popular forecast models with an option to use with satellite/SSB connection)
The apps are free, but many advanced features like higher model resolutions and weather routing are charged for. Predictwind requires a subscription while for LuckGrib there is only one-time fee.
Useful manuals:
7-day GRIB forecasts that can be downloaded locally
Provides worldwide Surface Wind (10 m above sea level), Surface Pressure, Visibility, Cloud Cover and Precipitation forecast charts. The charts are derived mainly from the 0.25-degree GFS (Global Forecast System) model which is run four times daily, with a forecast output of 180 hours (7.5 days). Higher-resolution Surface Wind charts are available for parts of the world and use other models.
GRIB files viewer (PC only)
Provides worldwide GRIB files to download and view offline. Forecasts are based on the GFS model.
Very good forecasts for Mediterranean (GFS + regional models)
https://www.lamma.rete.toscana.it
“Vento a 10 m” means surface wind; “Raffica” means gusts; “Altezza Onda” means wave height
Good forecasts for the Baltic & North Sea
Text reports: https://www.dwd.de/EN/ourservices/seewetternordostseeen/seewetternordostsee.html
Polish forecasts and warnings in textual form: https://baltyk.imgw.pl
Polish weather forecast service: https://maps.meteo.pl
Polish weather service with excellent synoptic explanations: https://www.meteo.pl
German forecasts: https://www.dwd.de
Swedish forecasts: https://www.smhi.se
Spain forecasts for Atlantic coast (Portugal to Africa) and Mediterranean
https://www.aemet.es - click “Predicción” to get textual info and “Mapas” to view charts
https://www.eltiempo.es - very fast service
Shipping forecast and gale warnings for North Sea and North Atlantic
Weather Services for Souther Hemisphere
Australia: http://www.bom.gov.au/
New Zealand: https://www.metservice.com/
Japan: https://www.jma.go.jp/jma/indexe.html
South Africa: https://www.weathersa.co.za/
Pilot (Routing) Charts
Pilot charts are very useful for long-distance passage planning. They depict averages in prevailing winds and currents, air and sea temperatures, wave heights, ice limits, visibility, barometric pressure, and weather conditions at different times of the year around the world.
https://msi.nga.mil/Publications/APC
Below link to QuickSCAT sattelite wind measurements from 1999 to 2009 showing prevailing winds for each month of the year (The Climatology of Global Ocean Winds - COGOW)):
https://www.pitufa.at/oceanwinds/ http://numbat.coas.oregonstate.edu/cogow/
Average weather conditions by city and month
Latest actual weather reports (observations)
British Isles: https://www.xcweather.co.uk/
Europe: https://www.meteociel.fr/
Weather Buoys and Ship Observation Reports
Synoptic and Pressure charts for different levels
https://ocean.weather.gov/Atl_tab.php - synoptic charts from Ocean Prediction Center (OPC) covering Atlantic, Pacific and Arctic, including Navtex and HF broadcasts
https://ocean.weather.gov/shtml/briefing.php - Briefings for the Atlantic and Pacific including marine charts and text forecasts
https://www.metoffice.gov.uk/weather/maps-and-charts/surface-pressure - synoptic surface pressure charts from UK Met Office
https://www.weatheronline.co.uk - all kinds of charts (surface & 500mb pressure charts etc.) covering the whole globe
https://www.weathercharts.org/ukmomslp.htm - synoptic 500mb pressure charts from UK Met Office
https://ocean.weather.gov/past_products.php - archive of synoptic charts from Ocean Prediction Center covering Atlantic, Pacific and Arctic
http://www2.wetter3.de - a collection of current and historical weather predictions (focused on GFS and ICON models)
https://www.wetterzentrale.de - a collection of current and historical (archive) weather predictions for various models
Historical predictions of AROME model for Western Europe
http://wxmaps.org - forecast charts for the whole world
Thunderstorms forecast
Europe: https://www.estofex.org
World:
https://wxcharts.com/ - includes many useful forecasting charts like CAPE, Supercell Composite, Vorticity etc.
https://www.weatheronline.co.uk - contains many useful forecasting charts like Helicity, vertical sheer and convection index
Swell forecast
Primary for surfers but very useful for sailors to predict conditions near the coast.
Excellent forecasts for specific spots (e.g. lakes)
Tropical revolving storm (TRS) forecasts
https://www.nhc.noaa.gov - NOAA National Hurricane Centre providing prediction of tropical cyclones and active storms in the Atlantic and Pacific
https://www.ecmwf.int - European Centre for Medium-Range Weather Forecasts (ECMWF)
https://tropic.ssec.wisc.edu - CIMSS Tropical Cyclone Team
https://www.stormcarib.com - Caribbean Hurricane Network
Tide predictions
Websites:
- UKHO free access to 7-day tidal predictions as a tide table and tidal curve: https://easytide.admiralty.co.uk/
Apps:
- My Tide Times
- Navionics
Volcanic activity
https://uwiseismic.com - University of the West Indies Seismic Research Centre
https://volcano.si.edu - The Smithsonian Institution’s Global Volcanism Program (GVP)
Ice Forecast
https://www.polarview.aq - Ice charts and concentration
https://usicecenter.gov - US National Ice Center
https://www.navcen.uscg.gov - International Ice Patrol which monitors the iceberg danger in the North Atlantic Ocean
https://www.canada.ca/en/environment-climate-change/services/ice-forecasts-observations - Latest ice condition charts & forecasts from Canadian Ice Service
Weather forecast models comparison
Collection of links to various meteorological charts
METAR reports (Meteorological Aerodrome Report)
A METAR weather report is predominantly used by aircraft pilots, and by meteorologists, who use aggregated METAR information to assist in weather forecasting.
Air pressure changes and their meanings
Calculator for the forecast of Significant Wave Height (SWH)
Aerological surveys
Aerological surveys measure atmospheric air characteristics with height. It is a simple xy graph that represents at any particular time and place, the distribution of the air temperature, the dewpoint and the wind according to the altitude. The shape and position of the temperature and dew point curves are important to interpret and forecast nebulosity and thunderstorm risk.
EGC and NAVTEX
The Worldwide Met-Ocean Information and Warning Service (WWMIWS) provides marine meteorological warnings and forecast information via International Enhanced Group Call (EGC) Service and NAVTEX, within the Global Maritime Distress & Safety System (GMDSS).
Navtex was developed to provide low-cost, simple and automated maritime safety information (MSI) to the ships (range of about 250 NM). The below website provides online NAVTEX messages for all METAREAS.
Maritime Safety Information (MSI) Leaflet for Northern Europe
The Mariners Weather Log
A publication of the National Weather Service (NWS), contains articles, news and information about marine weather events and phenomena, worldwide environmental impact concerns, climatology studies, storms at sea, and weather forecasting. The MWL provides meteorological information to the maritime community, and contains a comprehensive chronicle on marine weather.
Satellite imagery
Europe’s imagery with different satellite channels: https://produkty.chmi.cz
World imagery from geostationary satellites: https://www.sat24.com
Historical images from geostationary satellites: https://www.sat24.com/history.aspx
Traffic density
MarineTraffic is an open, community-based project, which provides real-time information on the movements of ships and the current location of ships in harbours and ports.
A part of Marine Traffic functionality is a density map that shows how many vessels sailed in a particular region per year. You can observe, for example, how sparsely visited are higher latitude areas compared to more popular routes. Why this is useful? First, you get an idea of how many ships are expected around and second, weather forecast models generally work better in areas where there is more commercial traffic as ships send regular SYNOP messages en route that is used as input data for the models.
https://www.marinetraffic.com - click “Density Maps” on the left pane
Clouds classifications and characteristics
Wonderful cloud photo and video gallery
Weather Fax (HF Radiofacsimile) broadcasts
Retrieving HF weatherfax on your smartphone or computer using HF radio
General materials
Met Office articles about the weather: https://www.metoffice.gov.uk/weather/learn-about/weather
Met Office factsheets: https://www.metoffice.gov.uk/research/library-and-archive/publications/factsheets
Met lectures from the University of Arizona: http://www.atmo.arizona.edu/students/courselinks/fall14/atmo336/lectures.html
Met lectures from the University of Colorado: https://atoc.colorado.edu/~saraht/atoc1050/Class_News/
Met lectures from the University of California: https://www.ess.uci.edu/~yu/class/ess124/
Frank Singleton’s Weather and Sailing Pages: https://weather.mailasail.com/Franks-Weather
US Navy Training manuall: Aerographer’s Mate Module 5—Basic Meteorology: https://www.militarynewbie.com/wp-content/uploads/2013/11/NAVEDTRA-14312-Aerographers-Mate-Module-5-Basic-Meteorology.pdf
All about hurricanes
North Atlantic Basin: https://www.nhc.noaa.gov/marinersguide.pdf
Forecasting Supercell Thunderstorms: https://www.lakeeriewx.com/Meteo361/ResearchTopicThree/ForecastingSupercells.html
How to read 500mb charts
Intro: http://oceanweatherservices.com/featured_blog_posts/the_use_of_the_500_mb_chart_at_sea
Lecture: http://www.atmo.arizona.edu/students/courselinks/fall14/atmo336/lectures/sec1/info500mb.html
User guide to OPC Radiofacsimiles: https://ocean.weather.gov/UsersGuide/UGprint.php
NOOA Mariner’s Guide to the 500mb charts: https://www.vos.noaa.gov/MWL/dec_08/milibar_chart.shtml
Books
Check the full list here
- Look out the window at the developing weather and be aware of the environment around you. You are right on the spot, with all the critical information at your fingertips (wind direction and strength, clouds, barometer readings, waves). If you add this to what you see on a synoptic chart or hear on a weather broadcast, you are in a good position to make an accurate forecast.
- The winds aloft (500mb) are the steering winds that guide the storms and other Low pressure patterns across the globe. These winds not only steer the surface Lows, but can also deepen them. Strong winds aloft usually mean strong winds on the surface. It is important to remember that forecasts are not makred good or bad. In reality some are better than others, and these 500-mb maps can help you make this judgement yourself. With 500-mb charts we are not trying to make a better forecast. We are just trying to assign some level of confidence to the forecasts given to us.
- Cold fronts and surface storm centers (Lows) move at abo'ut 1/3 to 1/2 of the wind speed of the 500-mb winds. Surface wind speeds on the cold-air side of moving Lows will be about 1/2 of the speed of the winds at 500-mb.
- In wintertime the 5640 m height contour on 500-mb charts is an excellent indication of the southern extension of surface winds of Beaufort scale force 7 "westerlies" (28-33 kts or occasionally greater). In summer the 5640 m height contour is more representative of force 6 surface "westerlies" (22-27 kts to occasionally force 7).
- In Lows, air is converging at the surface due to warm air rising and diverging aloft. In Highs this is reversed. If divergence aloft increases over a Low, more air is leaving than going in, so the Low deepens. Thus, when a Low wanders into a location with stronger winds aloft that enhance the diverence it can deepen the Low, creating stronger surface winds. Therefore, position of the winds aloft has a major influence on the weather we experience especially in mid-latitudes (eg. in the UK).
- Comparing apps that use the same numerical models does not really make sense as you are just going to see the same information in each.
- Weather applications use different colours on charts so make sure that you understand them well if you use multiple apps. The numerical models available are what make a difference.
- ECMWF and some other models are generally more reliable than GFS and have better resolution. The SPIRE model is currently ranked 1 for wind speed and direction accuracy using data from offshore weather buoys. It is ranked 2 behind the ECMWF for land-based weather stations. Newer models like ECMWF have a very high acquisition cost, and this is why the data was not been widely used by many weather websites so far (that has changed in recent years) and has been traditionally used only by top yacht racing teams and meteorologists.
- Long-term forecasts make sense on the open ocean but not necessarily in more closed seas with a huge land effects like the Mediterranean.
- Know your model resolution. Models have typically a resolution/grid of 25 km (some have higher and some lower) which means that anything in between the grid points (in the range of 25 km) need to be interpolated. Models filter out detail which result in a smoothing effect, so the strongest winds are not well represented. Imagine that you have a wind speed predicted to be 30kn and 20kn between consecutive grid points. In that case, the model would show 25kn in between the grid points, but the actual wind there could be much bigger if there is a front and the wind change suddenly. Models are also likely to fail to resolve topographic feature of smaller islands.
- Reliable predictions usually stop at 40-45kn (it might be guessing beyond that).
- Models are not taking shallow waters into consideration, so you have to judge yourself what the waves are going be near the coast, banks, reefs and harbours.
- Start checking the weather forecast a week before the passage to observe patterns and inconsistencies. Listen to successive forecasts to see if there are changes in the timing and wind strengths. Inconsistencies between successive forecasts imply uncertainty and mean that you should be rather more careful (doubtful) because the weather is likely to be unstable and hard to predict.
- On the ocean the waves are far more important for safety than the wind.
- Check the wind gusts forecast and compare it with the regular wind because a big difference may cause shock stress and damage to the rig and sails.
- Look at rain and CAPE to understand where the front bands and turbulent weather is.
- Add a safety margin to predictions (say 20% or so), especially in areas where the wind could be accelerated (e.g. Canaries acceleration zones, where the wind can change from 3 to 7 Beaufort in a matter of seconds). Despite the means available today, meteorology is not an exact science.
- On an east ocean coast (west of a High), fair weather summertime winds typically come from the S quadrant (SW to SE) as wind flows around the offshore High. In these cases, the wind that signals an approaching weather system is more likely to be a building wind than a shifting wind. The approaching Low (or more likely front) coming in from the west quadrant will bring with it wind that is already from the S quadrant so the first tendency of the local wind is to build rather than shift. However, on the west coast (east of a High), a backing shift is the first key indicator of potential bad weather. In a west coast situation, this backing shift will generally start before the wind builds.
- When a Nothern Hemisphere front passes (any kind, any place), the wind will make a sudden veer (changes clockwise). In the Southern Hemisphere, the wind always backs (backs the clock - counterclockwise) at a front.
- To know which side of a deep low you are, take note of the wind shifts. The wind veers in the dangerous semicircle of a passing hurricane. Dangerous semicircle is the side of a tropical cyclone, which lies to the right of the direction of movement of the storm in the Northern Hemisphere (to the left in the Southern Hemisphere), where the storm has the strongest winds and heavy seas. The wind will back in the navigable semicircle - the side of a tropical cyclone, which lies to the left of the direction of movement of the storm in the Northern Hemisphere (to the right in the Southern Hemisphere), where the winds are weaker and better for the navigation purpose
- "4-5-6" is a rule that can be used for forecasting strong winds using a barometer. When you are in fair weather to begin with, any pressure drop of 4 or 5 mb in a 6-hr period is a definite warning of the possible approach of a Low or frontal system.
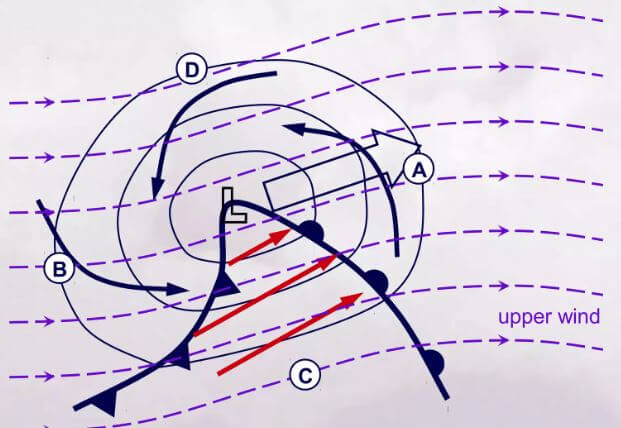
- Crossed-Winds Rule: As per Buys Ballot's Law if a person stands with their back to the wind, the atmospheric pressure is low to the left (left arm out and slightly forward - 30 degrees or so). If the person can estimate the direction of the upper-level winds from the motion of high-level clouds (storm track), they can determine where they are relative to the Low center, hence making a rough forecast. At position "A" the Low center is headed straight toward you; at "B" it has passed; at "C" it is passing to the north, and at "D" it is passing to the south and getting farther away.
- If you see a black low cloud, strong winds are to come with the first rain (black means there is a lot of rain accumulated in the cloud). If not yet raining, the worst may be yet to come. If already raining the worst may be past. If the rain from a distant cloud is straight down, there is little cloud motion and hence weak winds below it. If the rain angle is steep, it implies fast clouds and stronger winds on the surface.
- Over the sea, the surface wind speed is generally about two-thirds (2/3) of the geostrophic wind speed. Over the land, the surface wind speed is generally about one-thirds (1/3) of the geostrophic wind speed (reduced due to increased friction). You can read the geostrophic wind speed from the geostrophic wind speed scale on Met Office Synoptic Charts.
Fair Winds and Following Seas!
- Related articles:
- Meteorology